Phenotype Visualization
Flapjack can import supplementary phenotype (trait) data that is associated with the genotype data set.
Importing phenotypic data
To import phenotype data into Flapjack, open up the Import Data dialog and select the Phenotypes tab where you can choose the file to import.
Phenotypes can be imported from files containing the following tab-delimited format:
# fjFile = PHENOTYPE
             Trait1       Trait1       Trait2
             Experiment1  Experiment2  Experiment1
Line1        50           High         Short
Line2        2.3          High         Medium
Line3        99.3         Low          Long
Trait data for a single trait can be either numerical or categorical. The line containing experiment information for each trait is optional.
Phenotype summary information
One the phenotypes are imported, Flapjack will display a summary table of the data within the Trait Data node associated with the main data set. This is a matrix of data with lines down the left hand side and phenotypes across the top of the display. Each intersection of a line and a phenotype represents a phenotype value.
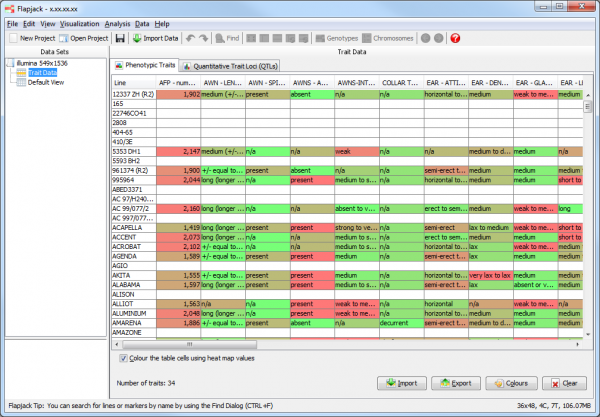
By default the phenotypes values are displayed in a heatmap format, with green representing low values and red representing high values. These colours can be changed either Flapjack wide, or for a specific trait by clicking the Colours button on the Phenotypic Traits tab of the Trait Data view and selecting new colours from the Trait Colours dialog.
Visualizing alongside genotype data
When you load phenotypic data into Flapjack, Flapjack selects the first three traits found in the file and displays them in a heatmap next to the main graphical genotype display. To select which phenotypes are in the heatmap, select Data->Select traits to open the Select Traits dialog. Select the traits you wish to display next to the lines in the genotype view, then click OK.
Sorting by phenotype
Sort the lines by your phenotypic data by right clicking on a phenotype and choosing Sort A-Z or Sort Z-A when you have categorical data loaded, or Sort smallest to largest’ or Sort largest to smallest when you have numerical phenotype data loaded. You can also carry out an advanced sort by selecting Analysis->Sort lines->By trait.
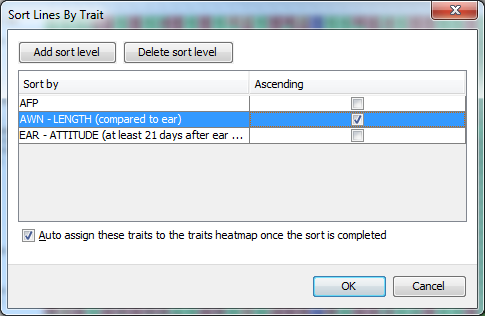
This type of sort allows you to sort by one trait first, then for lines which share values for that trait you can sort within those by a secondary trait and so on. By default the dialog will display a sinle trait to sort by and whether or not the sort will be in ascending order. You can add these secondary (tertiary, n-ary) sorts by clciking the Add sort level button. If you decide to remove a sort level, simply click on the row you wish to remove then select Delete sort level. Note the Auto assign these traits to the traits heatmap once the sort is completed checkbox. If this is checked it will automatically display the traits used to carry out your sort next to the genotypes.