Filter QTLs
The Filter QTLs dialog (Data->Filter QTLs) is used to enable or disable the display of QTLs on the map based on a combination of the values assigned to each QTL for its associated trait and experiment.
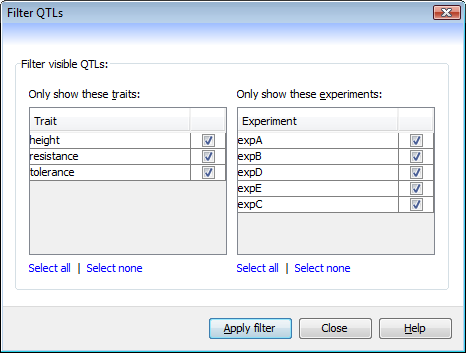
The dialog presents two tables; one showing a list of every trait within the current QTL data set, and another showing a list of every experiment. The QTLs can be filtered by selecting a combination of trait and experiment, so that only QTLs that match the values of both tables will be left visible.
To apply the current filter, click the Apply filter button. The effect takes place immeditately and you can check the result in Flapjack without closing the Filter QTLs dialog.
Note also, that the checked values within the tables may change dynamically when the filter runs. For example, say you had selected to show only QTLs that were assocaited with the trait height across experiments x1 and x2. If x2 has no QTLs with that trait then its checkbox will be cleared automatically when the filter runs.