Pedigree Verification (F1s Known Parents)
Tip
You can run this analysis as a Batch Analysis across multiple data sets (or views) at once.
This analysis provides several key statistics to determine whether a putative F1 sample is a true F1 cross.
In addition to this help page, you can also read the Pedigree Verification (F1s Known Parents) Tutorial, which runs through the process of running the analysis and viewing the results with a sample dataset.
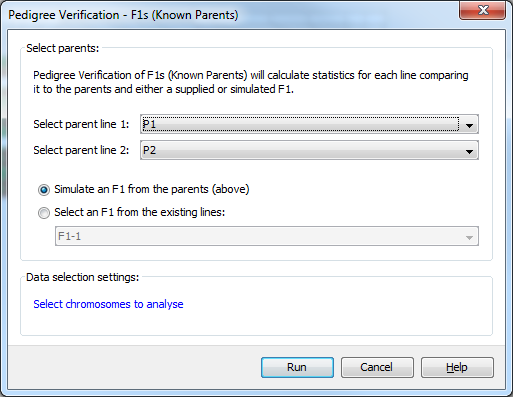
Using the Pedigree Verification - F1s (Known Parents) dialog you can select the two parental lines in your data file. You can also select whether to simulate an expected F1 from the parents you have selected, or to use an expected F1 which was defined in the input data.
Options
If you choose to simulate an F1, Flapjack will generate an expected F1 line from the two parental lines that you selected in the dialog. To do this, Flapjack compares the alleles of the two parental lines to determine the alleles for the expected F1. If either parent has missing or heterozygous data at a marker, the expected F1 is left as missing data. For other markers, if parent 1 is A/A and parent 2 is A/A, then the expected F1 is A/A. If parent 1 is A/A and parent 2 is T/T, then the expected F1 is A/T.
The following statistics are provided following F1 analysis in the ‘Results View’;
Data count- the number of markers with non-missing values.% Data- the number of markers with non-missing values as a percent of the total markers for a sample.Het count- the number of markers with heteozygous genotypes (i.e. alleles that differ) for a sample.% Het- the number of markers with heteozygous genotypes as a percent of the total markers for a sample.% Het Deviation from Expected- the difference in % hets between the expected F1 and the sampled F1.% Allele match to Parent 1 / Parent 2- alleles matching between the sampled F1 line and the sampled parent line, as a percentage of non-missing data in both the F1 line and parent line, and across all markers for a sample. e.g. if F1 = A/A C/C and sampled P1 = A/T N/N then % allele match to P1 is 50% ie 1 allele at a marker in the sampled F1 matches a P1 allele for the same marker, out of 2 non-missing alleles available for comparison.% Genotype match to Expected F1- matching gneotypes (i.e. both alleles need to match) between the sampled F1 line and the simulated F1 as a percentage of non-missing data in both the F1 line and the simulated F1, and across all markers for a sample. e.g. if sampled F1 = A/T C/C and the simulated F1 = A/T C/T , then % genotype match to expected F1 is 50%. Only 1 marker genotype out of 2 matches at both alleles.
Note
Expected F1 alleles can only be simulated if both parents have homozygous alleles. If either parent has a heterozygous call or missing data for a marker, then the expected F1 allele data cannot be simulated and will have a missing value.
Understanding the statistics
The statistics can be used to select lines as follows;
Data Count and % Data- since for many F1 tests a small number of markers are used, results can first be filtered by these statistics to eliminate potentially skewed results.% Het and % Het Deviation from Expected- an F1 made from a cross between two inbred lines will have elevated % heterozygosity compared to parents. Therefore, these two statistics will indicate whether a cross has been successfully made. There should be very little deviation in % het values between the expected F1 and the sampled F1. In the case that a putative F1 sample has low % hets and high deviation from expected, then the sample is most likely an inbred line and not a true cross.
Warning
The exact thresholds for determining whether a sampled F1 is a true F1 of the designated parents, or else the result of outcrossing or selfing, have not been defined here, as the thresholds can depend on many factors including the level of genotyping error in your experiment, or the level of genetic similarity between parents and any alternate possible parents.
Below are various combinations of values for the statistics that can help determine whether you have a true F1, or else have a self or outcross.
A true F1 from the expected parents:
| % Heterozygous Deviation from Expected F1 | Low |
| % Allele Match to Parent 1 / Parent 2 | Medium |
| % Genotype Match to Expected F1 | High |
A self a of parent, or sample is the parent (seed mix-up):
| % Heterozygous Deviation from Expected F1 | High |
| % Allele Match to Parent 1 / Parent 2 | High |
| % Genotype Match to Expected F1 | Low |
An F1 cross between parent 1 and an unknown inbred:
| % Heterozygous Deviation from Expected F1 | Low |
| % Allele Match to Parent 1 | High |
| % Allele Match to Parent 2 | Low |
| % Genotype Match to Expected F1 | Low |
An F1 cross between two unknown inbreds:
| % Heterozygous Deviation from Expected F1 | Low |
| % Allele Match to Parent 1 | Low |
| % Allele mMtch to Parent 2 | Low |
| % Genotype Match to Expected F1 | Low |